HighCharts笔记之: Bar Chart

最近需要做一些Web图标,研究了几个开源的第三方工具后,最后决定使用HighCharts开发:
Highcharts 是一个用纯JavaScript编写的一个图表库, 能够很简单便捷的在web网站或是web应用程序添加有交互性的图表,并且免费提供给个人学习、个人网站和非商业用途使用。目前HighCharts支持的图表类型有曲线图、区域图、柱状图、饼状图、散状点图和综合图表。
HighCharts界面美观,由于使用JavaScript编写,所以不需要像Flash和Java那样需要插件才可以运行,而且运行速度快。另外HighCharts还有很好的兼容性,能够完美支持当前大多数浏览器。
HighCharts 可以通过JSON 数据格式与后台交互,从而生成动态的图表。但是在官方的文档中关于 JSON 数据格式的资料很少,经过一下午的调试终于找到了关于柱状图和饼图的数据格式,在这里记录一下,以备后续的查询:
柱状图:
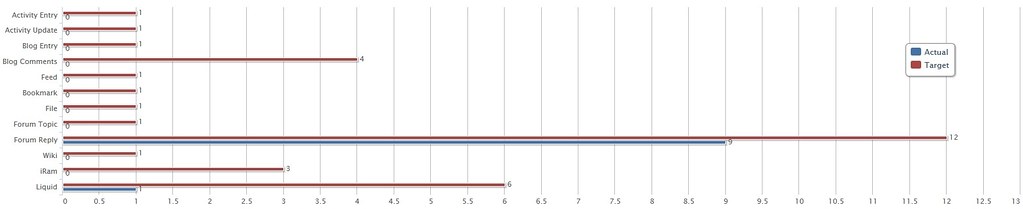
JSON Data
1 | [ |
Javascript code
1 | <script type="text/javascript"> |
HTML
1 | <div id="container" style="width: 100%; height: 400px"></div> |
Java Code - Action
1 | public ActionForward barChart(ActionMapping mapping, ActionForm form, |
Java Code - Bar class
1 | public class Bar { |
Java Code - Community class
1 | public class Community implements Serializable { |
- 标题: HighCharts笔记之: Bar Chart
- 作者: zjun
- 创建于 : 2013-03-28 16:52:00
- 更新于 : 2023-11-30 15:12:53
- 链接: https://zjun.site/2013/03/af0dd2fed41a.html
- 版权声明: 本文章采用 CC BY-NC-SA 4.0 进行许可。
评论